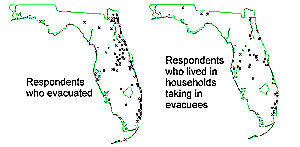
click for larger map

5.2% of the respondents lived in households which took in evacuees, corresponding to 325,377 households taking in evacuees (with margin of error, about 320,000 to 330,000). For the wording of the question, click here.
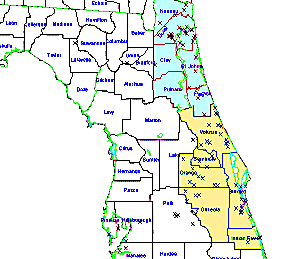
click to see larger map

36.8% of sample evacuated, corresponding to from 150,573 to 182,922 households given the margin of error.
Evacuation destinations of persons in the sample: 3% stayed in the area, 43% went to inland central and north Florida, 14% went elsewhere in Florida, 40% went to Georgia, Alabama, and a few other destinations outside Florida.
Central: [yellow]
26.8% of respondents evacuated, corresponding to from 209,812 to 238,089 households given the margin of error.
Evacuation destinations of persons in the sample: approximately 10% stayed close to home, 52% went to another location in inland central or north Florida, 33% went elsewhere in Florida, 6% went to destinations outside Florida.

click to see larger map

12.2% of respondents evacuated, corresponding to from 123,101 to 134,162 households given the margin of error.
Evacuation destinations of persons in the sample: approximately 50% stayed close to home, 11% went to the west coast of Florida, 29% went to location in inland central or north Florida, 11% went to destinations outside Florida. No one in the sample went to Miami- Dade County.
Miami-Dade County: [blue]
6.4% of respondents evacuated, corresponding to from 55,614 to 59,873 households given the margin of error.
Evacuation destinations of persons in the sample: approximately 73% stayed in Miami-Dade or Broward, 18% went to the west coast of Florida, 9% went to destinations outside Florida. No one in the sample went to central or north Florida.
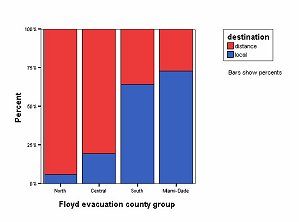
click to see full size chart
The chart shows a significant increase in the percentage of evacuees staying in their local area in south vs. north Florida (lower blue part of bar shows percent staying local). This result is probably evidence of the experience Floridians in the southern half of the state have had with evacuations for hurricanes Andrew and Erin. Experience says that it is much better to have an evacuation destination planned ahead, to a safe location in one's local area.
For Miami-Dade County there were two likely
additional factors. One was the restriction
of evacuation orders to coastal areas (and
mobile home parks). This could have given a
sense of security about evacuating to nearby
areas away from the coast. The other factor
was that Floyd was projected to go north.
Evacuating out of the area to the north thus
would not have made much sense.

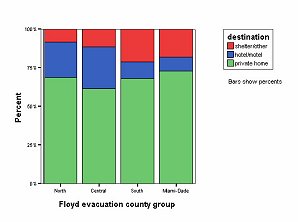
click to see full size chart
The south Florida selection of homes or shelters
over hotels was probably a result of hurricane experience in
two ways. One was that people probably had a plan for
what to do in the next hurricane. The other was
that they had faith in the forecasts, that the hurricane
would turn north. Late Monday and early Tuesday many
of the more affluent residents of the south Florida coast
who might have gone to hotels no longer had that option. The
next step in analysis of the data will be to see if there
is evidence for this.

click to see larger chart
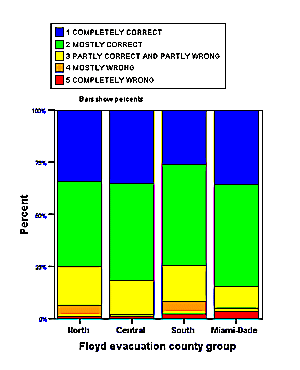
How would you evaluate the decisions made by officials in your area concerning Hurricane Floyd? Would you say they were completely correct, mostly correct, partly correct and partly wrong, mostly wrong, or completely wrong?
Overall, most said the decisions were correct or mostly correct. 79% felt official decisions were correct or mostly correct. There were some variations from zone to zone, but they were not statistically significant.
Respondents who were not happy with official
decisions were asked in an open-ended what they
disagreed with. These data are still being coded
and analyzed.

click to see larger chart

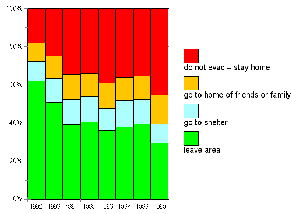
In the future, if you had two days notice to prepare for a hurricane of the intensity of Hurricanes Floyd or Andrew, which of the following would you be most likely to do? Would you leave the area completely in order to get out of the path of the storm, would you go to a shelter, would you go to stay with family or friends in the area, or would you stay in your home during the storm?
This question has been asked every year since 1992 (right after Hurricane Andrew -- only change is mention of Floyd added this year). Since it is a hypothetical question, it shows evacuation rates much higher than can be expected to actually happen.
The three years after Andrew saw a drop in the percent of people who would evacuate (not stay home). That percentage then stayed at approximately the same level from 1994 to 1998. In 1999 after the experience of Floyd there is another decrease in the percent of people who say they will evacuate.
Two interpretations of this are possible. One is that experience of a hurricane or a near miss by a hurricane makes people more aware of the problems incurred from evacuation and more likely to think they can survive a big one. The "cry wolf" phenomena fits in here. The second interpretation stems from the fact that hypothetical questions about some future possible hurricane tend to elict much higher evacuation estimates than one would see in a real hurricane. In this interpretation the "experience effect" simply says that people get more realistic about hurricane evacuation once they have some experience. Probably both interpretations play a part in producing this data trend.
This "experience effect" is even more pronounced for people who live in areas which experienced hurricane force wind from Hurricane Andrew. Click here to see past results comparing people in areas of south Broward and Miami-Dade counties which experienced Hurricane Andrew winds..


